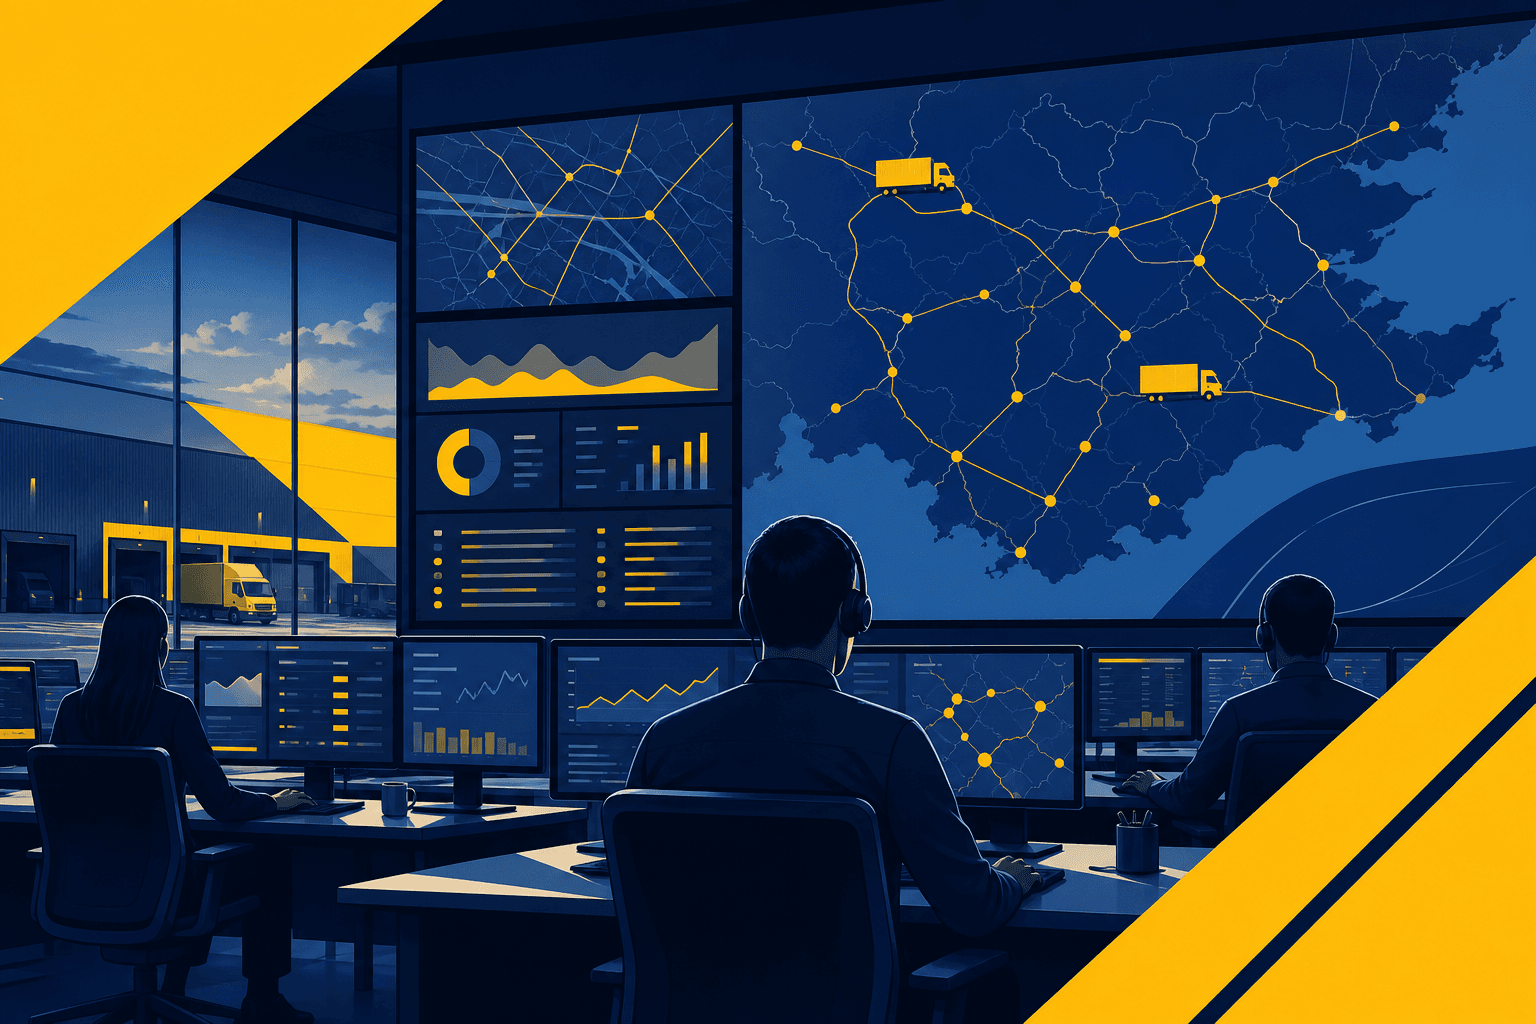
In the rapidly evolving landscape of software development, preventing application outages has become as crucial as deploying new features. Observability-driven development offers a forward-thinking approach that focuses on integrating monitoring and instrumentation into every phase of an application's lifecycle. This proactive strategy helps developers and operations teams to detect trends, anticipate issues, and resolve them before they affect the end users. Adyantrix, with its extensive expertise in IT services, employs these practices to ensure that the applications we build are robust and highly available.
The Importance of Observability in Software Development
Observability allows developers to gain comprehensive insights into the internal states of applications by examining the outputs or "data exhaust" such as logs, metrics, and traces. Unlike traditional monitoring, which often relies on pre-defined queries or alerts, observability provides the flexibility to ask new questions and gain insights as unfamiliar issues arise. According to the survey conducted by New Relic in 2022, companies with high observability practices resolved issues 47% faster than those with basic monitoring capabilities. By adopting observability-driven development, Adyantrix ensures that clients not only become aware of potential issues faster but also have the tools to understand and address these issues effectively.
The three pillars of observability — logs, metrics, and traces — each answer a different question about your system. Logs tell you what happened: they are discrete, time-stamped records of events. Metrics tell you how your system is behaving over time: they are numerical measurements sampled at regular intervals, such as request latency percentiles or database connection pool utilisation. Traces tell you where time was spent across a request that touched multiple services: they link a single user-facing operation through every service, database call, and external API it touched.
Real-World Example: Consider a healthcare app handling sensitive and critical patient data. Downtime or malfunctions could not only disrupt services but also endanger lives. By implementing observability, the application development team can predict, prevent, and rapidly troubleshoot system failures, ensuring high reliability and compliance with healthcare regulations.
Key Tools and Approaches for Observability
The market is replete with various tools that facilitate observability by helping developers monitor and instrument applications effectively. This section explores some prominent tools and compares their features.
| Tool/Approach | Key Features | Pros | Cons |
|---|---|---|---|
| Prometheus | Time-series database, metrics monitoring | Open-source, robust data collection | Complex setup, steep learning curve |
| Grafana | Visualization and alerting | Flexible dashboards, numerous integrations | Potential performance overhead |
| Jaeger | Distributed tracing | Excellent for microservices | Can have high storage requirements |
| DataDog | Full-stack monitoring & observability platform | Rich feature set, easy to use | Can be expensive for large-scale deployments |
| OpenTelemetry | Vendor-neutral instrumentation SDK and collector | Single instrumentation for all backends | Still maturing in some language SDKs |
These tools highlight that effective observability integrates diverse functionalities, including metric aggregation, log analysis, and distributed tracing. Adyantrix employs a tailored combination of these tools, ensuring that we select the right solution based on your application's specific requirements and architectural complexities.
Implementing Observability: Practical Steps
To truly benefit from observability, it is integral to weave it into the fabric of your development process from day one. Here is an annotated step-by-step guide to implementing observability in your application lifecycle:
Step 1 — Define What to Measure. Start by identifying critical paths, key transactions, and failure points in your application. Prioritise aspects that most impact user satisfaction and system performance. For an e-commerce platform, this means instrumenting the checkout flow, payment processing, and inventory reservation paths as a first priority.
Step 2 — Select Appropriate Tools. Based on your defined needs, choose a combination of monitoring and observability tools that best fit your application environment and objectives. OpenTelemetry is increasingly the right starting point because it provides vendor-neutral instrumentation — you instrument once and choose where to send data (Jaeger, Datadog, Grafana Tempo) separately.
Step 3 — Instrument with OpenTelemetry. OpenTelemetry provides SDKs for all major languages. Below is a Python example setting up tracing with the OTLP exporter to send spans to a local Jaeger instance:
from opentelemetry import trace
from opentelemetry.sdk.trace import TracerProvider
from opentelemetry.sdk.trace.export import BatchSpanProcessor
from opentelemetry.exporter.otlp.proto.grpc.trace_exporter import OTLPSpanExporter
from opentelemetry.sdk.resources import Resource

resource = Resource.create({"service.name": "checkout-service"})
provider = TracerProvider(resource=resource)
exporter = OTLPSpanExporter(endpoint="http://localhost:4317", insecure=True)
provider.add_span_processor(BatchSpanProcessor(exporter))
trace.set_tracer_provider(provider)

tracer = trace.get_tracer(__name__)

def process_payment(order_id: str, amount: float) -> dict:
    with tracer.start_as_current_span("process_payment") as span:
        span.set_attribute("order.id", order_id)
        span.set_attribute("payment.amount", amount)
        # payment logic here
        return {"status": "success"}
Every span created here is linked automatically to the incoming trace context — meaning if a frontend service initiates a trace, the payment service span becomes a child span in the same distributed trace. Jaeger or Grafana Tempo will then display the full trace waterfall, showing exactly how long each service and operation took.
Step 4 — Collect and Centralise Data. Ensure that all logs, metrics, and traces are collected at a centralised location. This data centralisation is crucial for effective analysis and quick incident response.
import logging

# Setting up structured logging
logging.basicConfig(
    level=logging.INFO,
    format='%(asctime)s - %(name)s - %(levelname)s - %(message)s'
)
logger = logging.getLogger(__name__)

logger.info('Application starting up.')
logger.info('Payment processed', extra={"order_id": order_id, "amount": amount})
For log aggregation at scale, a common pattern is to ship structured JSON logs from all services into a central store — Elasticsearch (ELK stack), Loki (Grafana stack), or a managed service like Datadog Logs. Structured logs (JSON key-value pairs rather than freeform strings) are far easier to query and aggregate than unstructured log lines.
Step 5 — Configure Prometheus Metrics. Prometheus scrapes metrics endpoints exposed by your services. A FastAPI or Flask service can expose a /metrics endpoint using the prometheus_client library:
from prometheus_client import Counter, Histogram, generate_latest, CONTENT_TYPE_LATEST
from fastapi import FastAPI, Response

app = FastAPI()

REQUEST_COUNT = Counter(
    "http_requests_total",
    "Total HTTP requests",
    ["method", "endpoint", "status_code"]
)

REQUEST_LATENCY = Histogram(
    "http_request_duration_seconds",
    "HTTP request latency in seconds",
    ["endpoint"],
    buckets=[0.01, 0.05, 0.1, 0.25, 0.5, 1.0, 2.5]
)

@app.get("/metrics")
def metrics():
    return Response(generate_latest(), media_type=CONTENT_TYPE_LATEST)
Prometheus then scrapes this endpoint on a configured interval (typically 15 seconds) and stores the time-series data. Alertmanager can be configured to fire alerts when metrics cross defined thresholds — for example, when the p99 request latency exceeds 500ms for more than two minutes.
Step 6 — Visualise Data in Meaningful Ways. Grafana connects to Prometheus, Loki, and tracing backends as data sources and lets you build dashboards from a unified interface. A well-designed service dashboard typically includes: request rate, error rate, and p50/p95/p99 latency (the RED method); infrastructure metrics such as CPU, memory, and network; and business metrics such as orders per minute or active sessions.
Step 7 — Review and Iterate. Establish a feedback loop where insights gathered from observability efforts lead to refinements in architecture and code. Regular reviews ensure continuous improvement and resilience.
By closely following these steps, Adyantrix can help you establish a robust observability framework tailored to your software products, vastly improving your ability to detect and resolve issues swiftly.
Overcoming Observability Challenges
Despite its vast benefits, implementing observability is not without challenges. These include handling large volumes of data, balancing performance overhead with insight gains, and bridging the gap between development and operations teams. Adyantrix acknowledges these challenges and helps clients navigate them by consulting on best practices and offering dynamic solutions that aid in minimizing disruptions while maximizing the benefits of observability.
Alert fatigue is one of the most common failure modes. Teams that instrument everything and alert on every anomaly quickly find that on-call engineers start ignoring pages. The solution is to alert on symptoms (customer-visible outcomes such as error rate or latency) rather than causes (CPU usage, memory). Symptom-based alerts are fewer, higher-signal, and more actionable.
Cardinality explosion in Prometheus metrics is another pitfall. Adding high-cardinality labels — such as user_id or order_id — to Prometheus metrics causes memory and storage to balloon because Prometheus maintains a separate time series for every unique label combination. Use low-cardinality labels (endpoint, method, status_code) in Prometheus metrics, and push high-cardinality identifiers into traces and logs instead.
Example Challenge: A fintech company may be overwhelmed by alerts due to volatile market conditions which can inundate support and development teams. By implementing efficient alert filtering and creating priority-based notification systems, it mitigates noise, allowing the team to focus on truly critical issues.
The Business Impact of Observability
Beyond technical advantages, observability plays a significant role in business operations. Improved application reliability can enhance user trust, impact customer retention rates, and ultimately drive revenue growth. For instance, a study from Gartner noted that companies investing in comprehensive application visibility saw a 15% boost in end-user satisfaction.
Shorter mean time to detect (MTTD) and mean time to resolve (MTTR) directly reduce the cost of incidents. When an engineering team can pinpoint the failing service and the root-cause query in under five minutes using distributed traces, rather than spending hours correlating logs across dozens of services, the savings compound across every incident over the year.
By incorporating observability, Adyantrix not only aids in maintaining technical excellence but also aligns applications with business objectives, ensuring that technology serves as an enabler for corporate goals.
Frequently Asked Questions
Conclusion
Embracing observability-driven development ensures applications are resilient, high-performing, and user-centric. By anticipating issues before they manifest, your business can significantly reduce downtime and improve user satisfaction. Adyantrix stands ready to guide your journey toward implementing a robust observability framework that aligns with your strategic goals. To explore how observability can transform your software development approach, consider partnering with Adyantrix's DevOps Cloud Solutions, where we offer tailored solutions designed for consistent success.